Compressive and tensile failure in vertical wells
Stress around circular cavity
$${}$$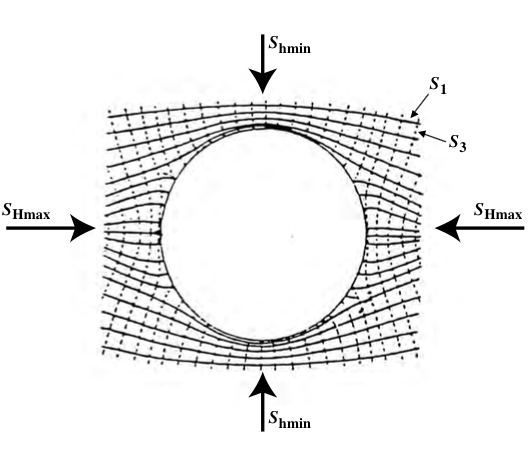
© Cambridge University Press Zoback, Reservoir Geomechanics (Fig. 6.1, pp. 169)
Kirsch solution
${}$
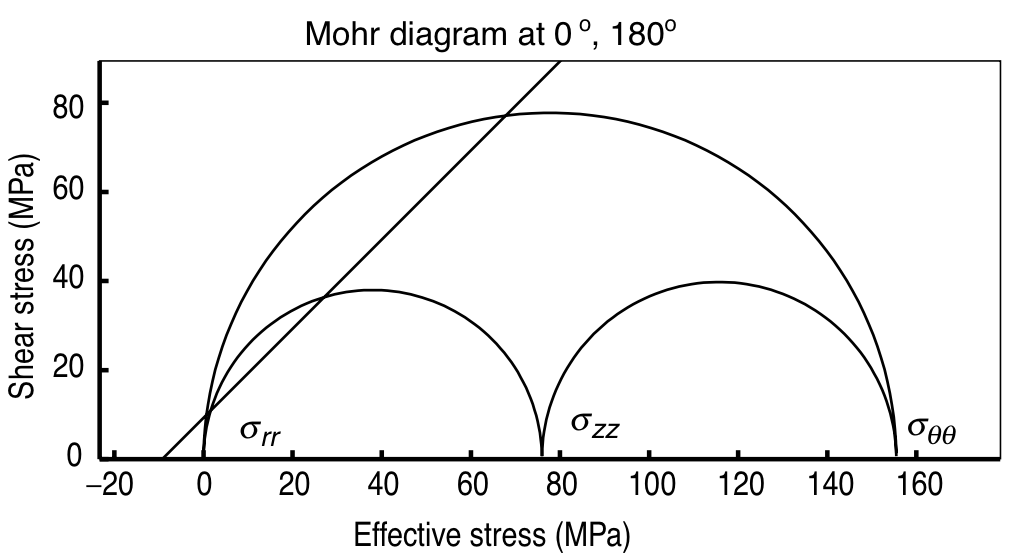
\begin{align} \sigma_{rr} &= \frac{ \sigma_{Hmax} + \sigma_{hmin} }{2}\left( 1 - \frac{a^2}{r^2} \right) + \frac{ \sigma_{Hmax} - \sigma_{hmin} }{2}\left( 1 - 4 \frac{a^2}{r^2} + 3 \frac{a^4}{r^4}\right)\cos 2\theta + (P_w-P_p)\left(\frac{a^2}{r^2}\right) \\ \sigma_{\theta\theta} &= \frac{ \sigma_{Hmax} + \sigma_{hmin} }{2}\left( 1 + \frac{a^2}{r^2} \right) - \frac{ \sigma_{Hmax} - \sigma_{hmin} }{2}\left( 1 + 3 \frac{a^4}{r^4}\right)\cos 2\theta - (P_w-P_p)\left(\frac{a^2}{r^2}\right) \\ \sigma_{r\theta} &= \frac{ \sigma_{Hmax} - \sigma_{hmin} }{2}\left( 1 + 2\frac{a^2}{r^2} - 3 \frac{a^4}{r^4} \right) - \sin 2\theta \\ \sigma_{zz} &= \sigma_v - 2 \nu (\sigma_{Hmax} -\sigma_{hmin})\left(\frac{a^2}{r^2}\right)\cos 2 \theta \end{align}Example
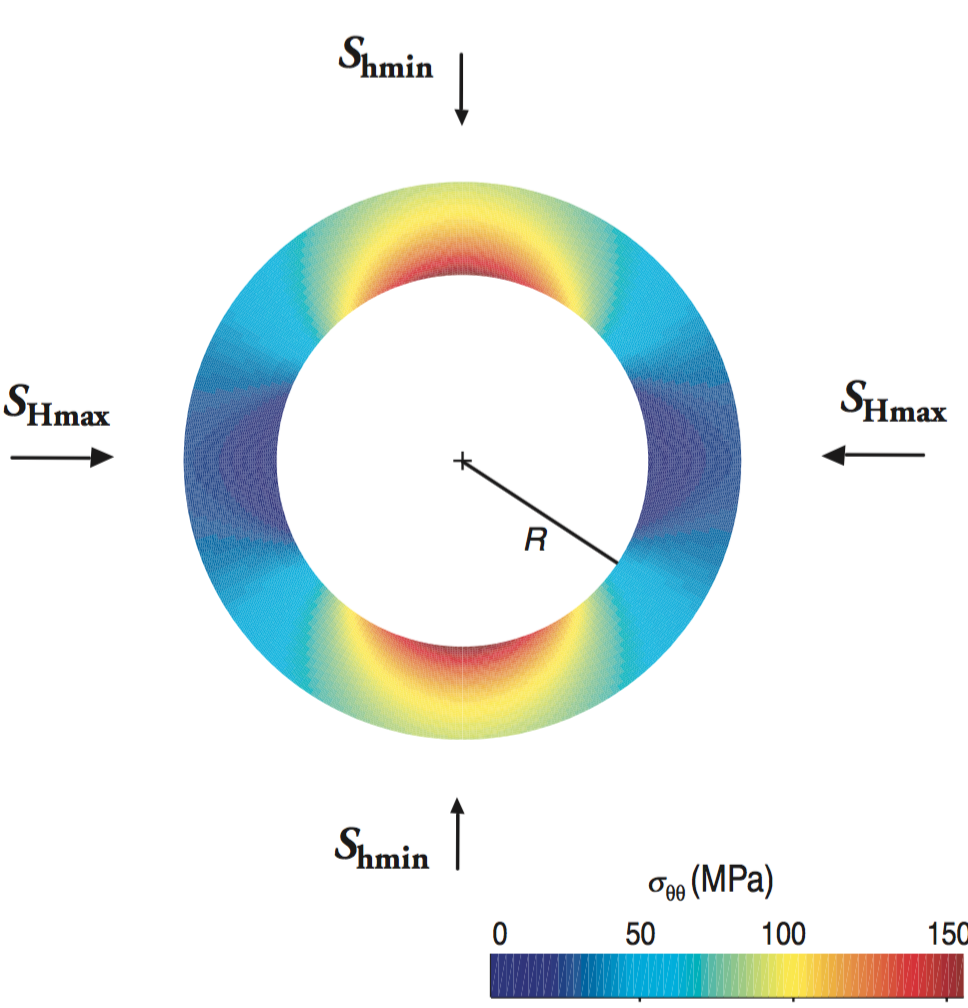
© Cambridge University Press Zoback, Reservoir Geomechanics (Fig. 6.2a, pp. 171)
${}$
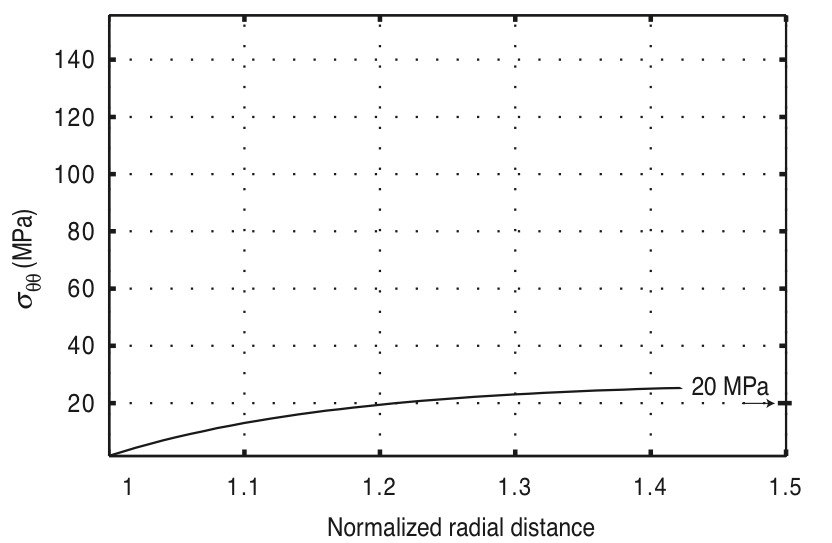

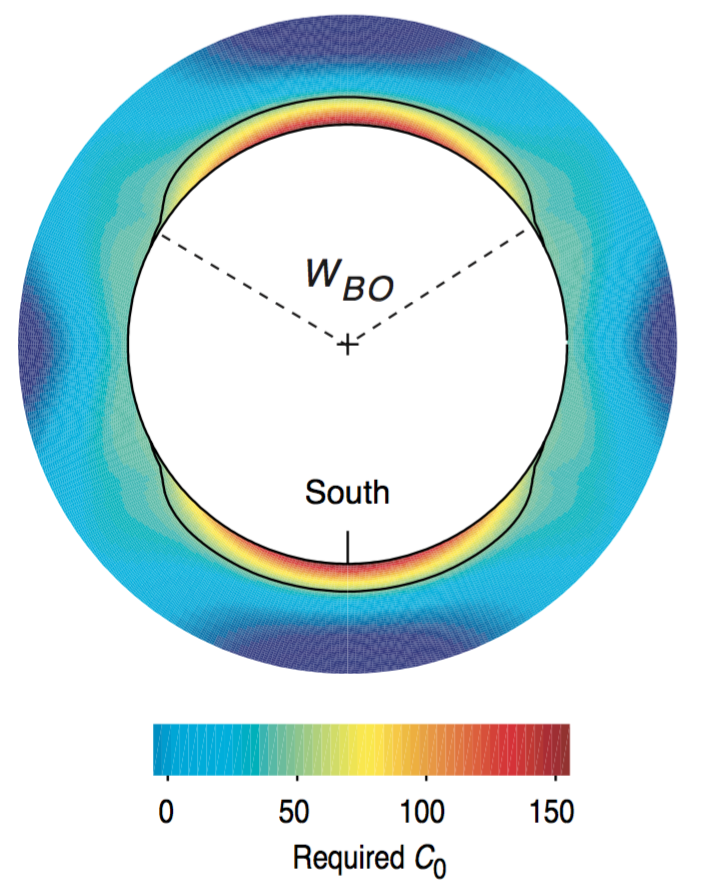
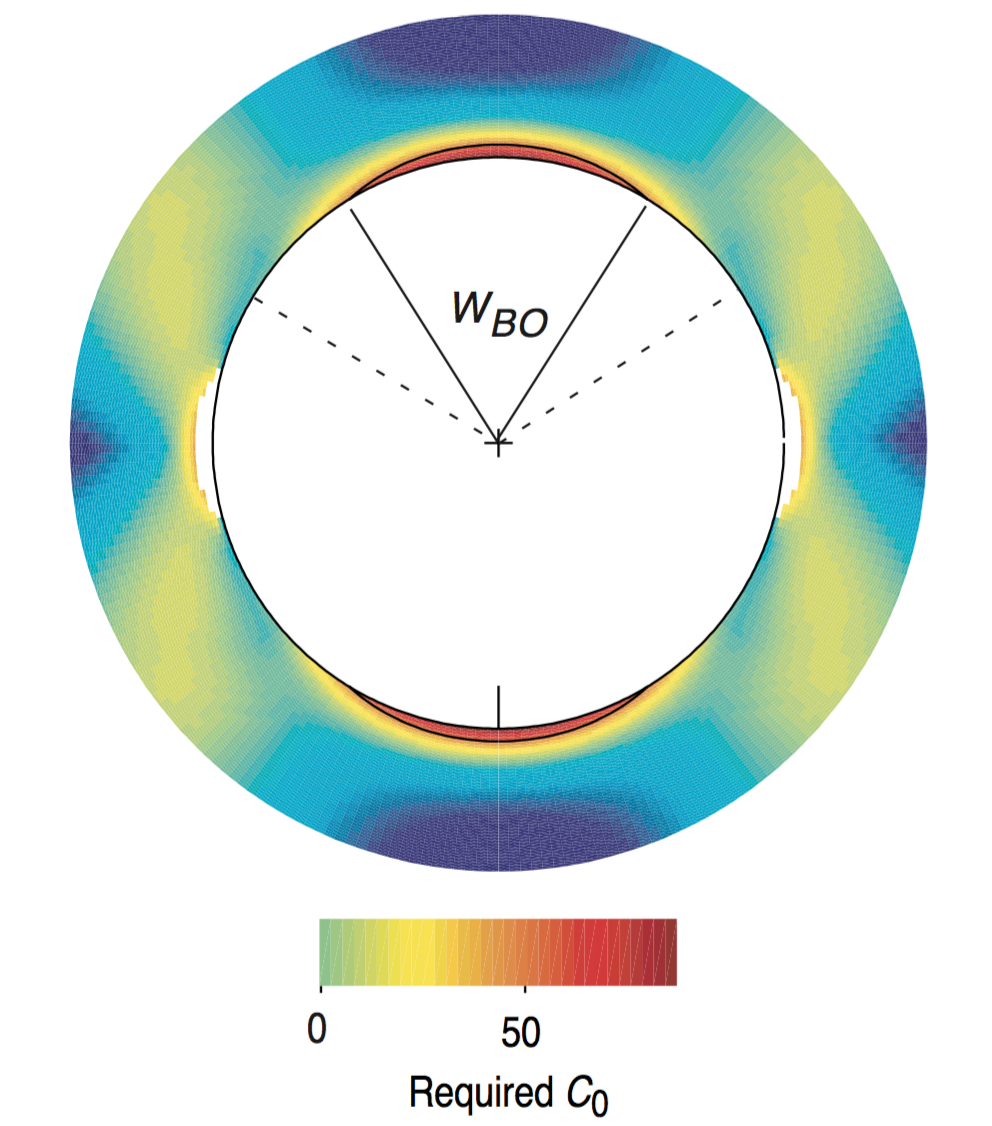
© Cambridge University Press Zoback, Reservoir Geomechanics (Fig. 6.2b,c, pp. 171)
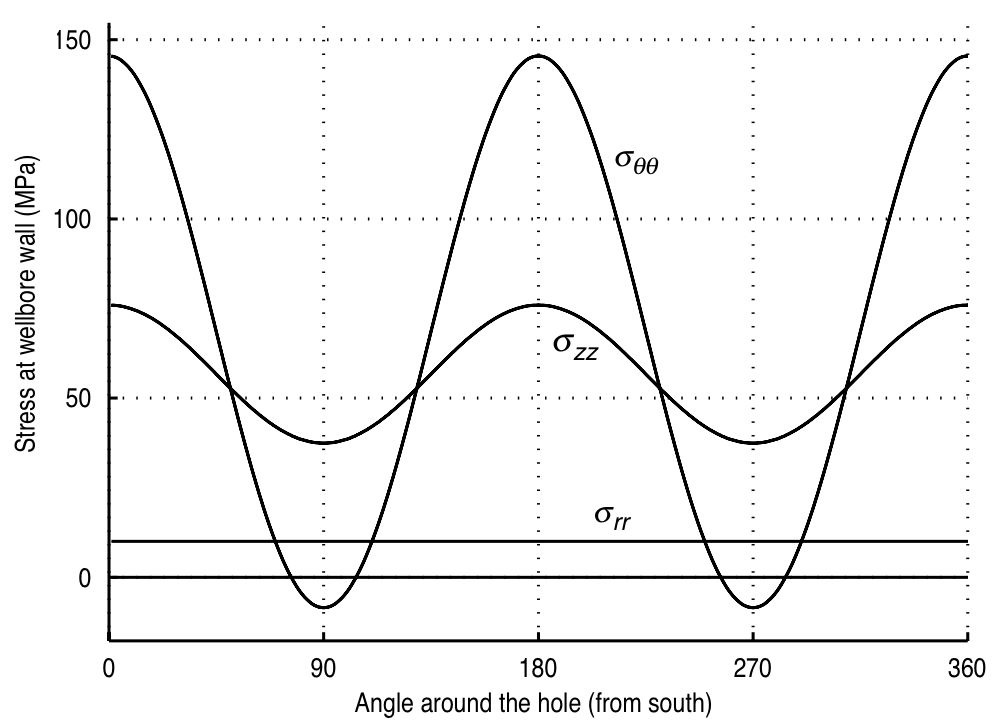
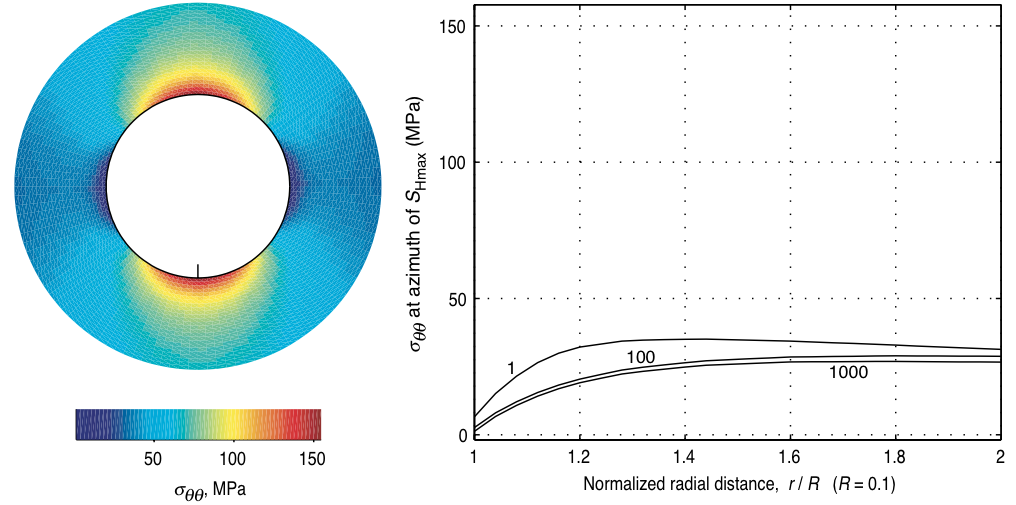
Variation of wellbore stresses
${}$
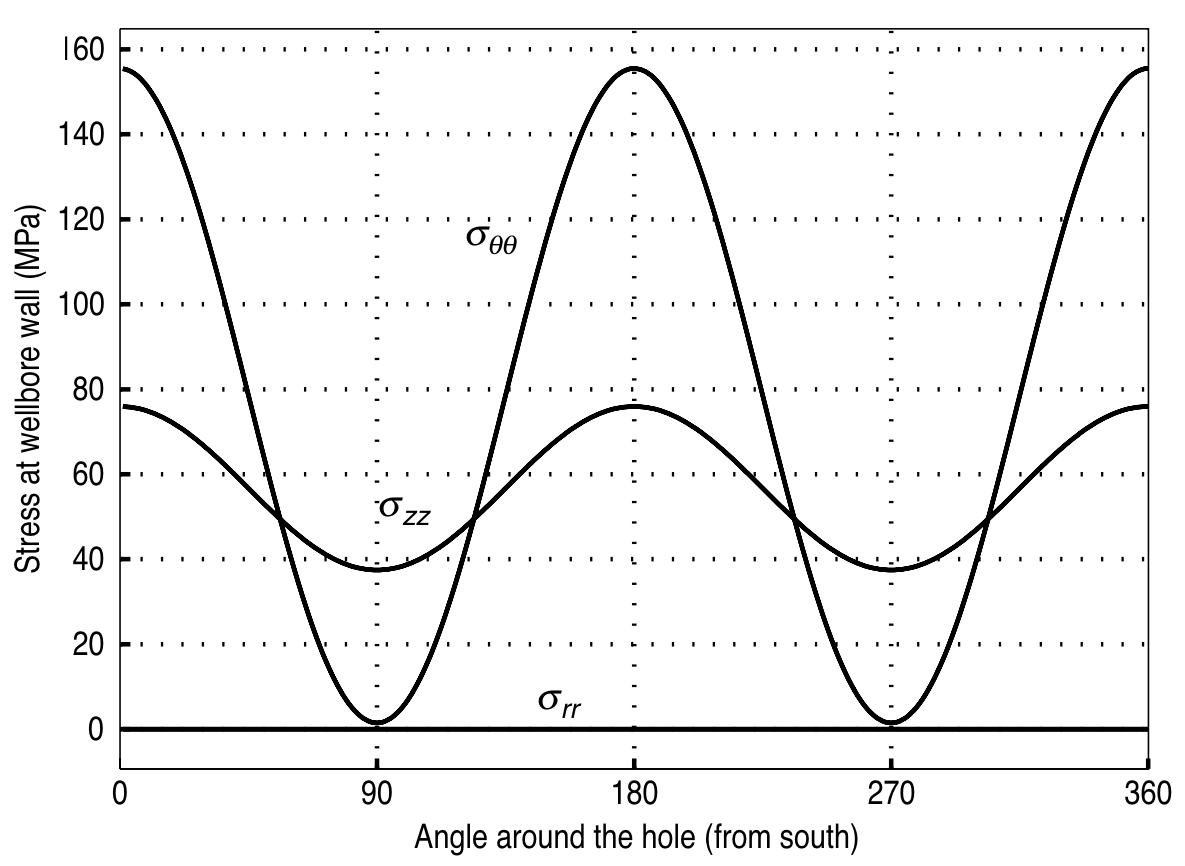
© Cambridge University Press Zoback, Reservoir Geomechanics (Fig. 6.3a, pp. 173)
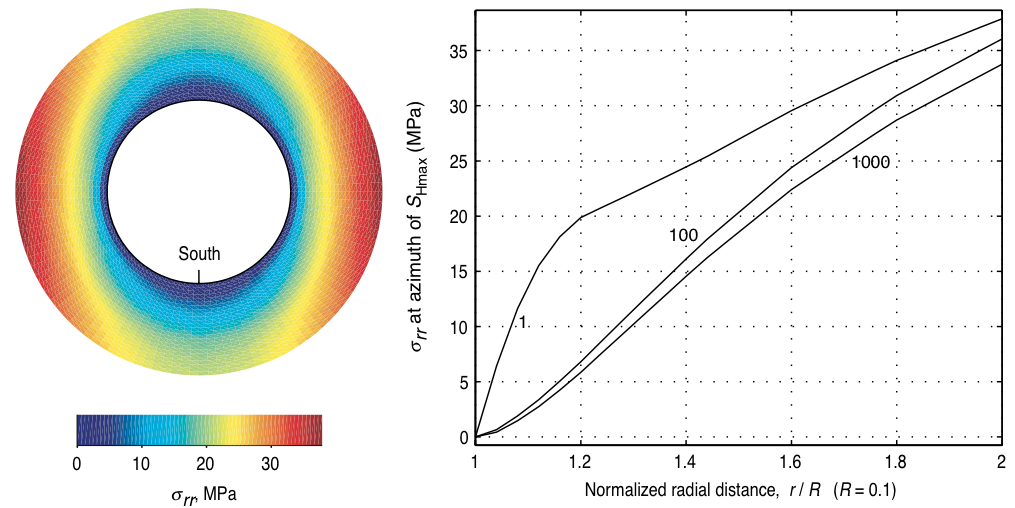
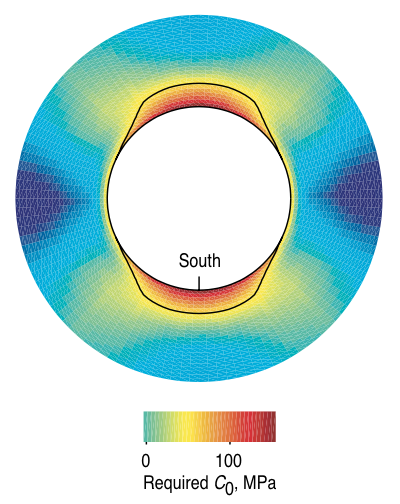
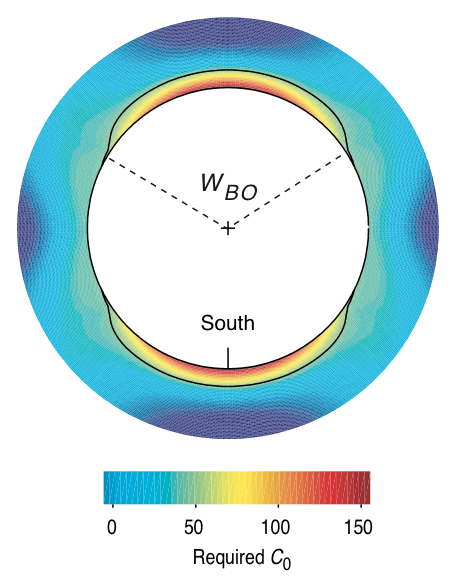
Wellbore breakout region
${}$
© Cambridge University Press Zoback, Reservoir Geomechanics (Fig. 6.3b,c, pp. 173)
Mudweight stabilization
As $\Delta P$ increases, $\sigma_{\theta\theta}$ decreases and $\sigma_{rr}$ increases.
© Cambridge University Press Zoback, Reservoir Geomechanics (Fig. 6.3b, pp. 173 and Fig. 6.5a, pp. 177)
Breakouts as indicators of far-field stresses
Simplify Kirsch equations at wellbore wall $a = r$, so
\begin{align} \sigma_{rr} &= (P_w-P_p) = \Delta P \\ \sigma_{\theta\theta} &= \sigma_{Hmax} + \sigma_{hmin} - 2 (\sigma_{Hmax} - \sigma_{hmin} ) \cos 2 \theta - \Delta P \\ \sigma_{zz} &= \sigma_v - 2 \nu (\sigma_{Hmax} -\sigma_{hmin})\cos 2 \theta \end{align}$\sigma_{\theta\theta}$ has min at 0$^\circ$ and 180$^\circ$
\begin{align} \sigma_{\theta\theta}^{min} &= 3\sigma_{Hmin} - \sigma_{Hmax} - \Delta P \\ \end{align}$\sigma_{\theta\theta}$ has max at 90$^\circ$ and 270$^\circ$, so
\begin{align} \sigma_{\theta\theta}^{max} &= 3\sigma_{Hmax} - \sigma_{hmin} - \Delta P \\ \end{align}so
\begin{align} \sigma_{\theta\theta}^{max} - \sigma_{\theta\theta}^{min} &= 4(\sigma_{Hmax} - \sigma_{hmin}) \end{align}Tensile induced fractures
© Cambridge University Press Zoback, Reservoir Geomechanics (Fig. 6.5a, pp. 177)
Safe drilling mud window
Mud weight too low
- Breakouts
Mud weight too high
- Tensile induced fractures leading to lost circulation
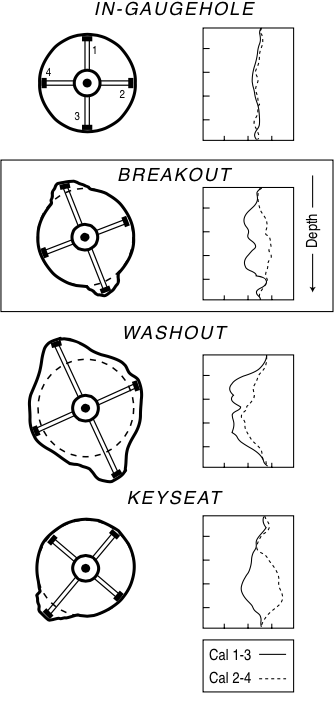
Imaging breakouts
${}$
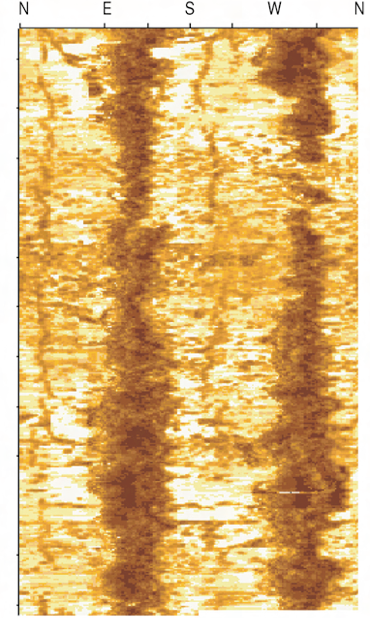
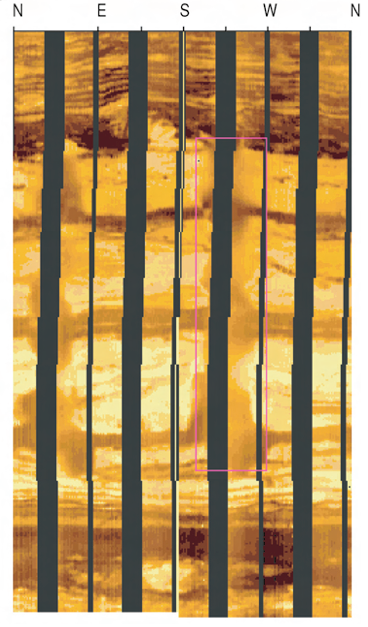
© Cambridge University Press Zoback, Reservoir Geomechanics (Fig. 6.4a,b,c, pp. 176)
Four-arm caliper data
${}$
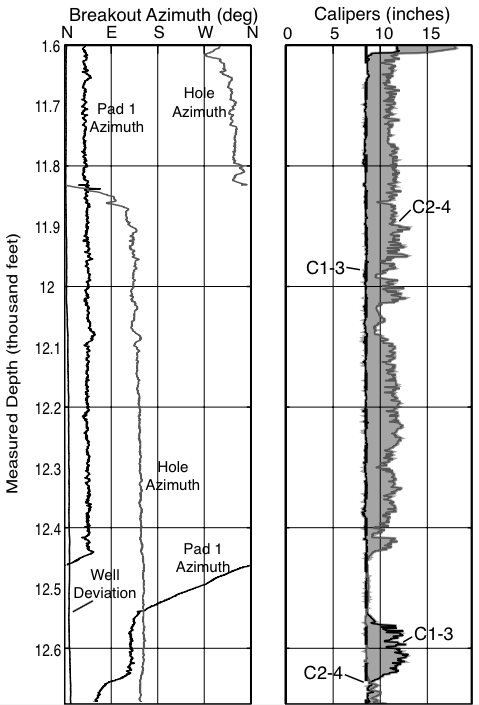
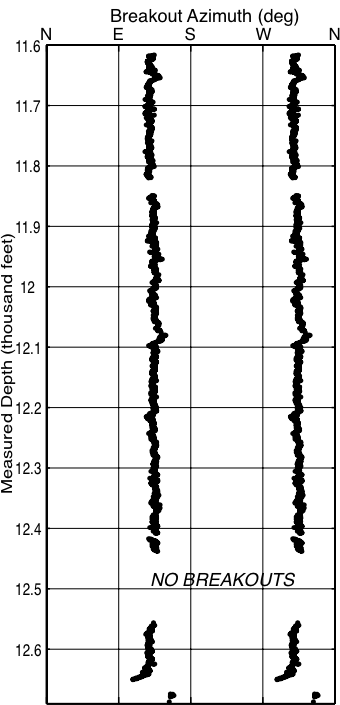
© Cambridge University Press Zoback, Reservoir Geomechanics (Fig. 6.9a,b,c, pp. 183)
Thermal effects on wellbore stress
${}$
Strongly time dependent
$$ \frac{\partial T}{\partial t} = \alpha_T \nabla^2 T $$$\alpha \to$ strongly depenendent of the silica content of the rock.
Under steady-state conditions,
$$ \Delta \sigma_{\theta\theta}^T = \frac{\alpha_T E \Delta T}{1-\nu} $$Time-temperature effects
© Cambridge University Press Zoback, Reservoir Geomechanics (Fig. 6.14a,b pp. 194)
Stability through cooling?
© Cambridge University Press Zoback, Reservoir Geomechanics (Fig. 6.14c pp. 194 and Fig. 6.3 pp. 173)
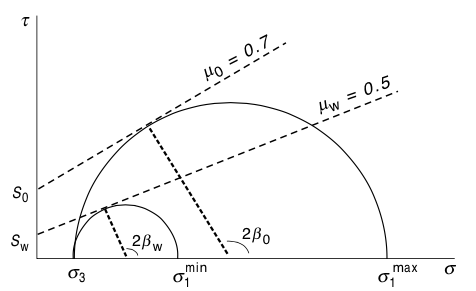
Rock strength anisotropy
$$ \sigma_1 = \sigma_3 \frac{2 (S_w + \mu_w \sigma_3)}{(1-\mu_w \cot\beta_w)\sin 2\beta} $$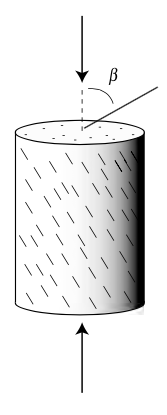
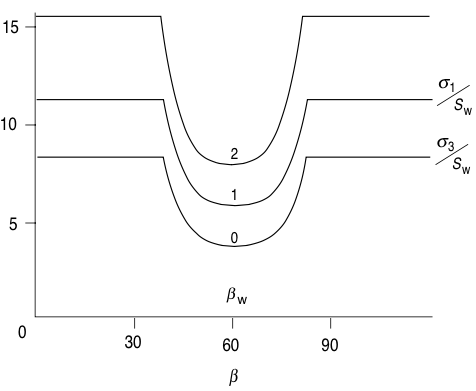
© Cambridge University Press Zoback, Reservoir Geomechanics (Fig. 4.12, pp. 106)
Rock strength anisotropy effects on breakouts
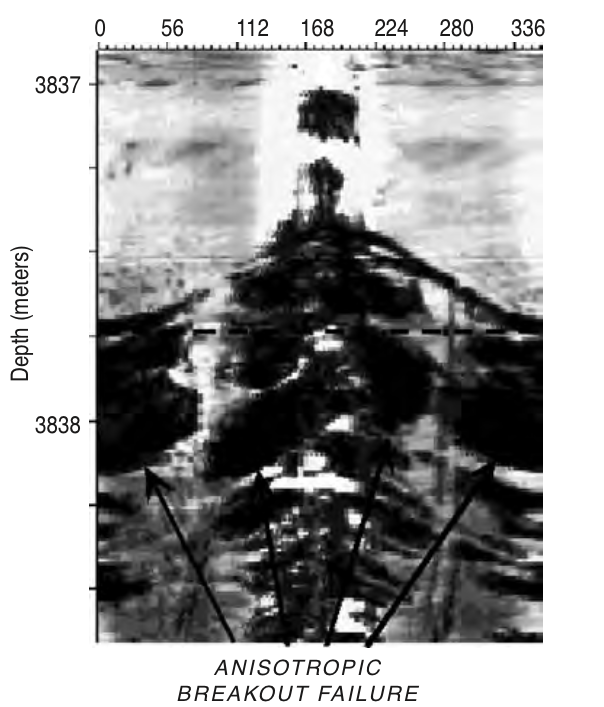
© Cambridge University Press Zoback, Reservoir Geomechanics (Fig. 6.16a,b pp. 199)
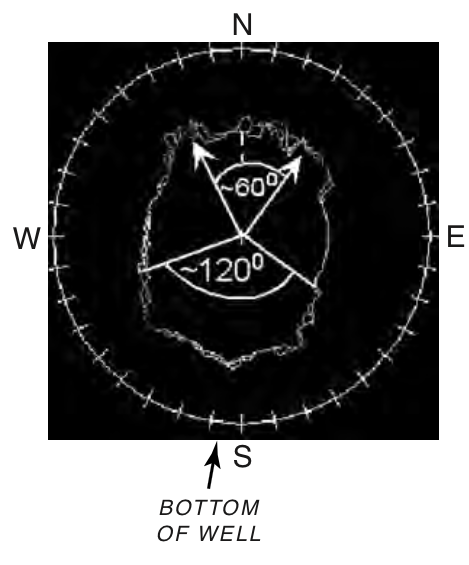
Two mechanisms
Stresses exceed intact rock strength
Stresses activate slip on weak bedding planes
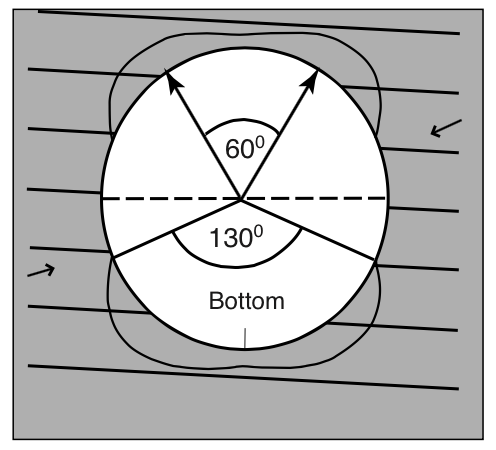
© Cambridge University Press Zoback, Reservoir Geomechanics (Fig. 6.16c pp. 199)
Chemical effects
- Water Activity ($A_w \sim \frac{1}{\mbox{salinity}}$) can to increased pore pressure
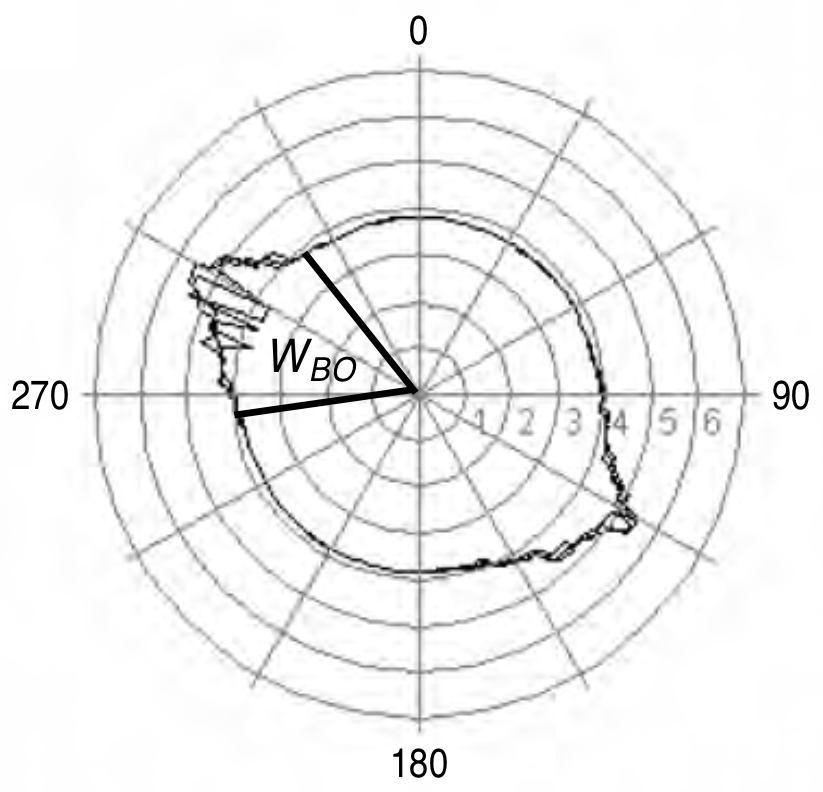
$S_{Hmax}$ from breakout data
${}$
$$ S_{Hmax} = \frac{(C_0 + 2 P_p + \Delta P + \Delta \sigma^T) - S_{hmin}(1 + 2 \cos(\pi - w_{bo})}{1 - 2 \cos(\pi - w_{bo})} $$Example
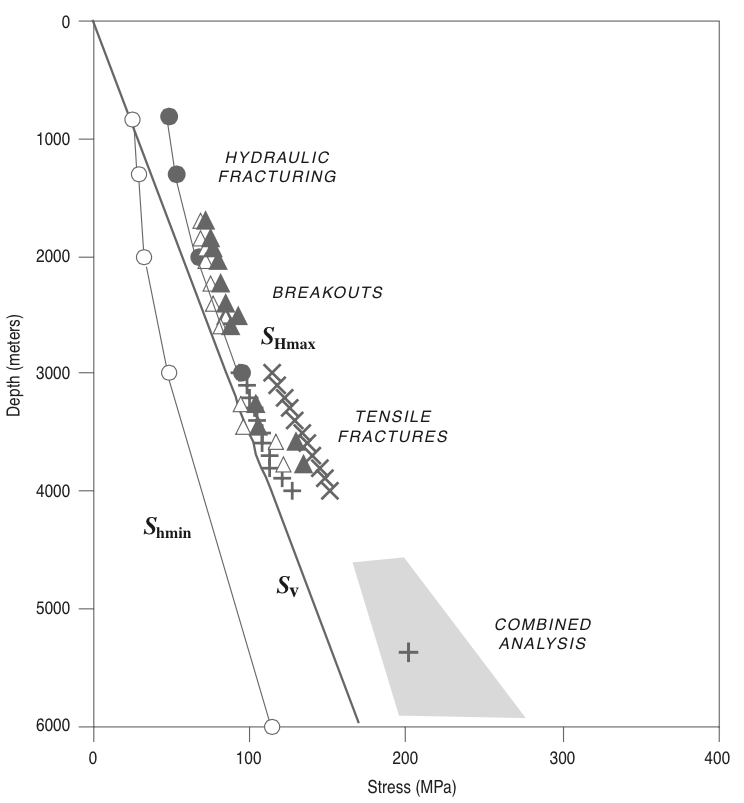
© Cambridge University Press Zoback, Reservoir Geomechanics (Fig. 7.7 pp. 223)
Wellbore stability
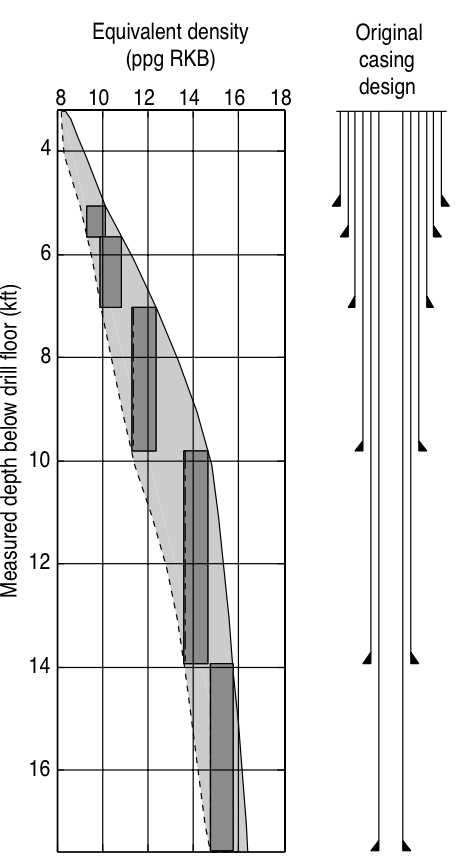
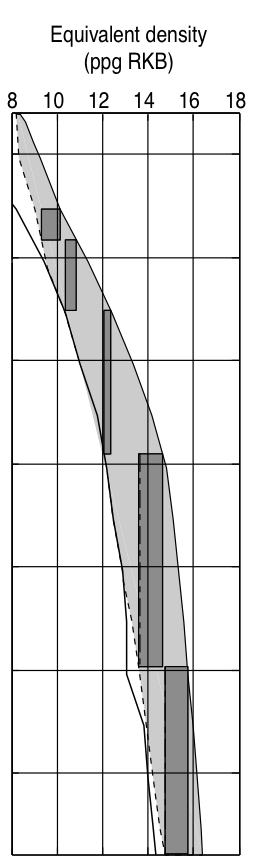
Defining a "stable" wellbore
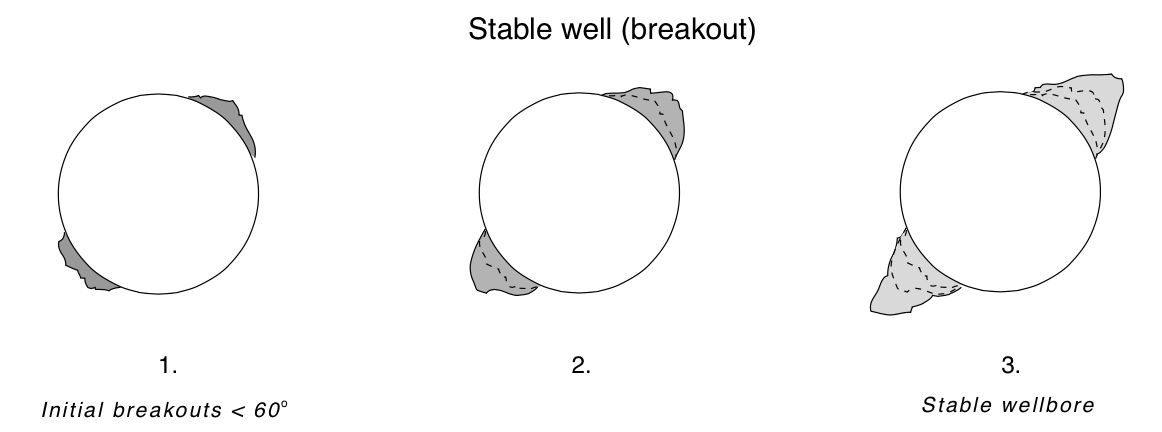
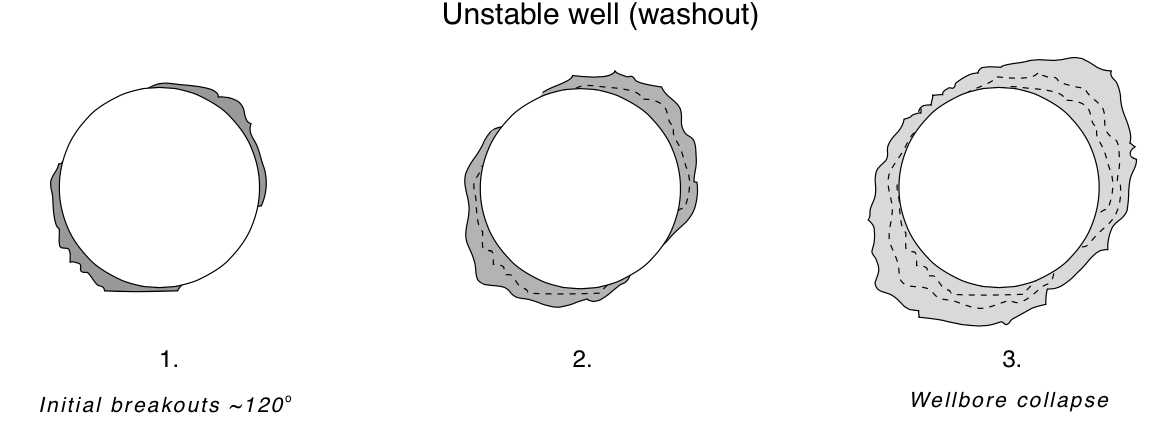
© Cambridge University Press Zoback, Reservoir Geomechanics (Fig. 10.1a,b pp. 304)
Emperical model: Maximum 90$^{\circ}$ breakouts
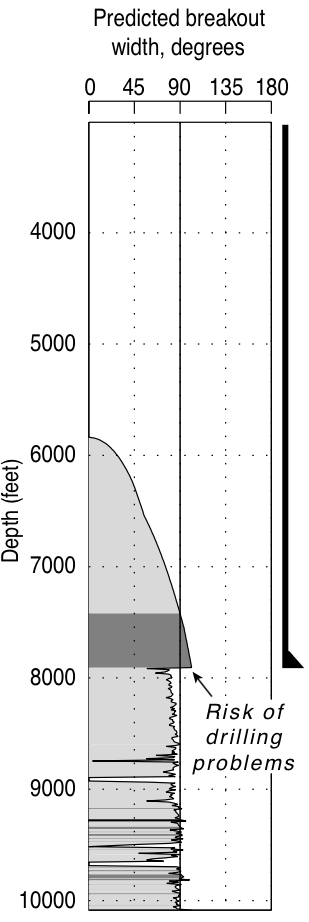
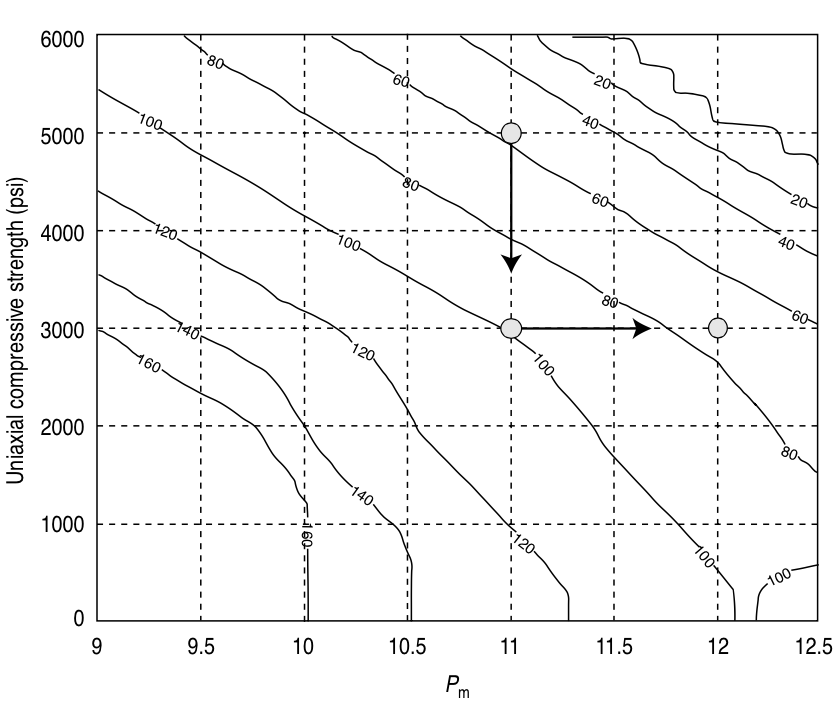
© Cambridge University Press Zoback, Reservoir Geomechanics (Fig. 10.2a,b pp. 305)
Comprehensive model
i.e. why your studying geomechanics
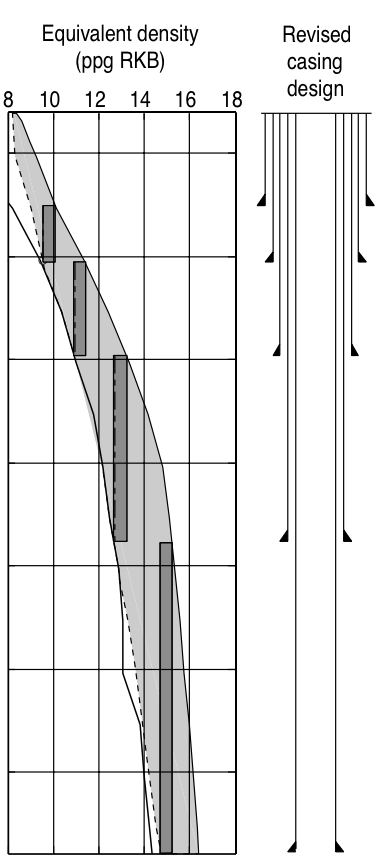
© Cambridge University Press Zoback, Reservoir Geomechanics (Fig. 10.3a,b,c pp. 307)
